Explain the P-value to a non-data person
Product Management Interview - A/B Testing: Explain the P-value to a non-data person
In A/B testing (comparing Version A vs. Version B of a product or page), we often see small differences in results. A p-value is a number that helps us decide if an observed difference is real or just random noise. In plain language, the p-value tells us “If nothing actually changed, how likely would we be to see results like this by chance?”. For example, if you change the color of a “Buy” button and sales go up a bit, the p-value tells you whether that bump is likely due to your change or just normal day-to-day variation. A very small p-value means the result is surprising under “nothing changed,” so you can be more confident the effect is real.
Think of a p-value like a coin-flip surprise meter. Flipping a fair coin normally gives about half heads and half tails. Getting 10 heads in a row is very unlikely (only about a 0.1% chance). If that happened, you’d suspect the coin is biased. In the same way, a p-value checks how unusual your test result is if the change had no effect.
For example, one guide explains that a p-value of 0.03 means only a 3% chance of seeing those results if the new feature did nothing. Because 3% is very low, we’d think the feature probably caused the change. On the other hand, a large p-value (say 50%) means “this kind of difference happens all the time by chance,” so we wouldn’t be surprised at all by luck.
Using P-values to Decide
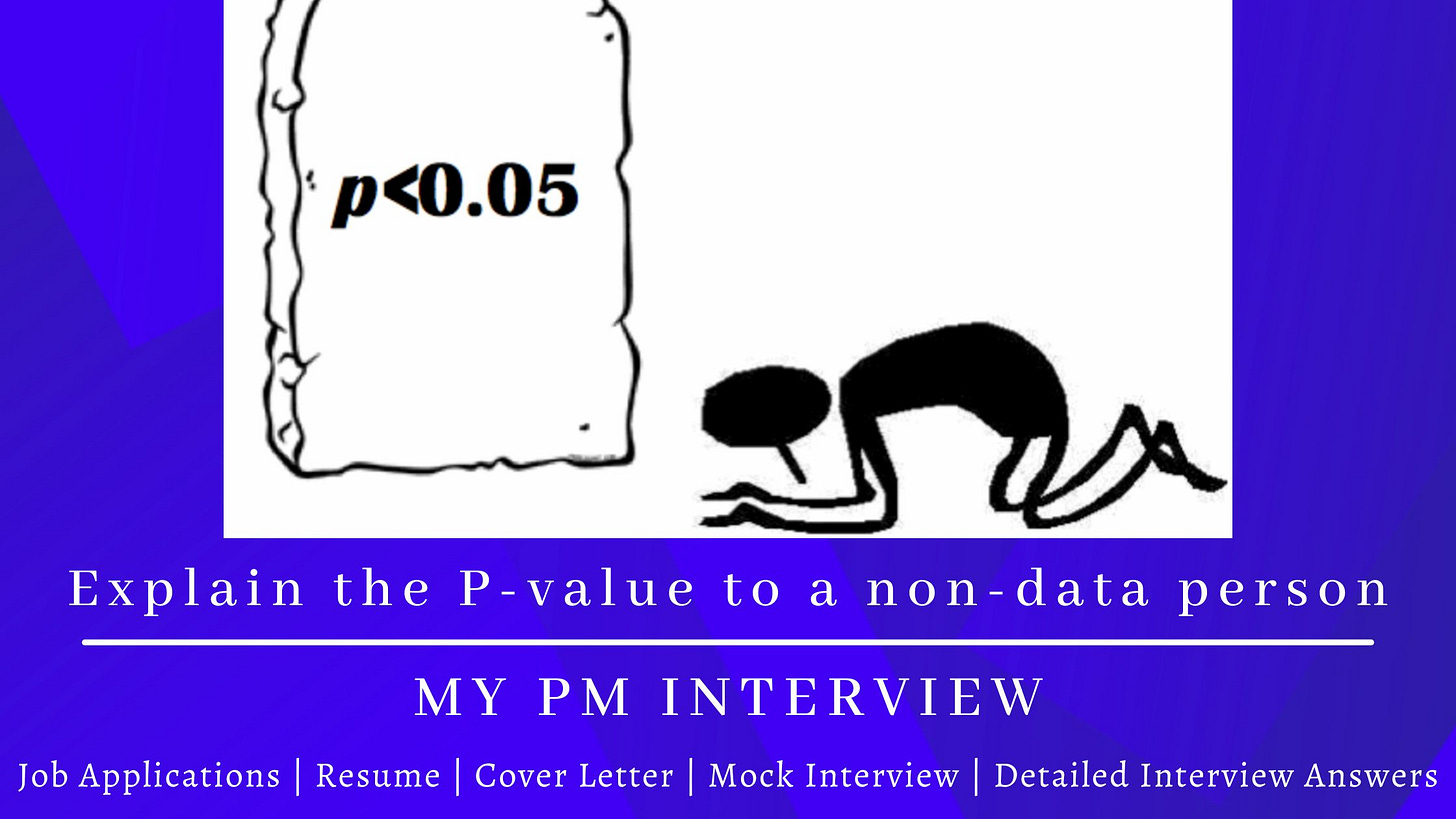
In practice, product teams often use a rule of thumb: if the p-value is below about 5% (0.05), the result is considered significant. It’s like saying, “this result would happen by chance less than 1 time in 20, so it’s probably meaningful”. If the p-value is above that (like 10% or 50%), it means similar results could easily happen by luck, so the test is inconclusive. In short, a small p-value gives confidence that the change really worked (the difference is likely real), while a big p-value suggests caution (it could just be noise).
For product decisions, this matters a lot. A low p-value (say 2% or 3%) tells us “we’d almost never see this result by luck, so the new version probably made the difference.” A high p-value tells us “nothing unusual here – this could be a random blip.” As one simple definition puts it, the p-value is “the chance of seeing this result if nothing really changed”. It’s a useful signal – but remember, not a guarantee. A p-value isn’t proof by itself (it “can’t prove anything with 100% certainty”); it’s just a way to measure how surprising the data are under the “no change” scenario. In the end, a small p-value helps product teams trust that an A/B test result is probably meaningful, whereas a large p-value tells them to be skeptical and maybe run more tests.


