
Should Instagram Stories Last Longer Than 24 Hours?
Meta Product Management Interview Question: You're a PM for Instagram Stories considering to increase the expiration time. What metrics would you examine?

Dear readers,
Thank you for being part of our growing community. Here’s what’s new this today,
Product Management Interview Question:
Q: You’re a PM for Instagram Stories considering to increase the expiration time. What metrics would you examine?
Note: This post is for our Paid Subscribers, If you haven’t subscribed yet,
Most candidates treat this as a simple metrics list exercise. They rattle off DAU, engagement rate, and NPS, and then feel satisfied. But the real signal the interviewer is looking for is whether you understand why the expiration time matters in the first place, and whether you can connect individual metrics to the underlying product hypothesis driving the change.
The hypothesis here is straightforward: if stories live longer, more people will see them, creators will feel rewarded, and overall engagement with the Stories surface will increase. That sounds reasonable. But a longer shelf life could also kill the urgency that makes Stories addictive. The FOMO loop is the entire point. When I think about this problem, I’m not just asking “what metrics go up?” I’m asking “what could go catastrophically wrong that we’d only notice six weeks after launch?”
Let me walk through the metrics I’d actually examine, roughly ordered by how quickly they’d give me a signal and how catastrophic they’d be to miss.
The Core Product Hypothesis You’re Testing
Before you instrument anything, you need to be crisp about what you’re trying to prove or disprove. Increasing expiration time could theoretically benefit two different user groups in conflicting ways.
Creators want their content to reach more people. A story that expires in 24 hours misses viewers who are traveling, sleeping in different time zones, or just busy that day. Extending to 48 or 72 hours could give a creator’s story 2-3x the organic reach without any additional effort. At face value, that’s a win.
Viewers, on the other hand, rely on the ephemeral nature of Stories to manage their consumption. The 24-hour window creates a natural queue: open Instagram, burn through today’s stories, done. If stories suddenly persist longer, the queue never fully clears. That’s cognitive load. It could make viewers feel behind, or worse, cause them to disengage from the surface entirely.
These two forces are in direct tension, and your metrics framework needs to capture both sides.
Consumption Metrics: What Viewers Actually Do
This is the first place I’d look because viewer behavior will move fastest and has the most direct read on whether the change is healthy.
Completion rate is my single most important signal. This measures the percentage of viewers who watch every frame of a story rather than tapping forward or swiping away. At Snapchat, completion rate was treated as the north star for Stories-format content because it captures genuine attention, not passive scrolling. If Instagram’s Stories completion rate sits at, say, 62% pre-launch and drops to 54% after extending expiration, that’s a 13% relative decline and a major red flag. It means the content pool is getting diluted with older, less relevant material that viewers are skipping through.
Viewer drop-off by frame pairs naturally with completion rate. You want to know not just whether viewers finish, but at what frame they bail. If drop-off spikes at frame 3 or 4 on stories that are 36-48 hours old, you now have directional evidence that older content is dragging the experience down specifically, which helps you design a fix (like showing newer stories first regardless of expiration window).
Time spent per viewer session on Stories tells you whether the format is capturing more attention or just generating more passive scrolling. This is different from raw watch time. I want to see engaged minutes, not total minutes. If time spent goes up 8% but completion rate drops 12%, the surface is technically bigger but qualitatively worse.
Story view velocity is a metric I’d push to define specifically for this experiment. It measures how quickly views accumulate in the first 6 hours after a story is posted. The hypothesis with extended expiration is that total views will increase, but if view velocity flattens significantly, it tells you creators are experiencing later engagement rather than more engagement. That matters for how creators feel about the change.
Creator Behaviour Metrics: The Supply Side
Story posting frequency
This is the most underappreciated metric in this entire analysis. If you extend expiration time, some creators will rationally post less often. Why post a new story today if yesterday’s is still live and accumulating views? That sounds fine in theory, but the Stories feed depends on a constant stream of fresh content. If daily posting frequency drops even 10-15% among your top 20% of creators, the feed gets stale and viewer engagement collapses downstream.
When I was studying Meta’s approach to News Feed, the team there learned the hard way that creator posting frequency and viewer retention are deeply coupled. A 15% drop in creator posting frequency in a given demographic segment correlated with a 9% drop in DAU for that segment within eight weeks. The effect was lagged, which made it easy to miss in a short A/B test.
This is a case study worth sitting with: In 2021, Instagram made a series of changes to how Reels were weighted in the algorithm, which had a downstream effect on Stories visibility. Several mid-tier creators (50k-500k followers) reported their Stories views dropping roughly 30-40% without any change in their own behavior. The root cause was that the feed algorithm was surfacing Reels more aggressively, crowding out Stories. Creator posting frequency for Stories dropped measurably within 90 days. Instagram partially reversed the weighting change six months later. The lesson: supply-side metrics (posting frequency) are a leading indicator of viewer engagement decay, but they lag the algorithmic or product change by weeks, not days. If you only run a 2-week A/B test, you will miss this entirely.
Content freshness index
This is a derived metric you’d need to build: the average age of stories in a user’s feed at the moment they open the app. If extending expiration to 48 hours causes the average story age to go from 6 hours to 14 hours, that’s a concrete freshness degradation that will eventually show up in viewer retention even if your short-term engagement numbers look flat.
Engagement Quality Metrics
Raw engagement numbers (likes, replies, shares) are table stakes. But for this specific change, I care more about engagement rate per story view than absolute engagement volume. Volume will naturally increase if stories are getting more views due to longer expiration. Rate tells you whether the content is still resonating.
Reply rate per story view
Swipe-up or link tap rate (for eligible accounts)
Poll and quiz interaction rate
Reaction (emoji) rate per view
I’d also track direct message (DM) initiations from Stories specifically. This is a higher-intent signal than a tap on a sticker. If DM initiations per story view stay flat or rise, the content is still driving genuine connection. If they drop, the content is being consumed passively or reluctantly.
Platform Health Metrics:
Cross-format cannibalization
Stories and Reels are already competing for creator attention and viewer time on Instagram. Extending expiration time for Stories could reduce the urgency that drives creators to post Reels (which are evergreen by nature). I’d watch Reels posting frequency among creators who also use Stories heavily. A measurable shift away from Reels production would be a product health concern, since Reels carry higher ad inventory value for Meta.
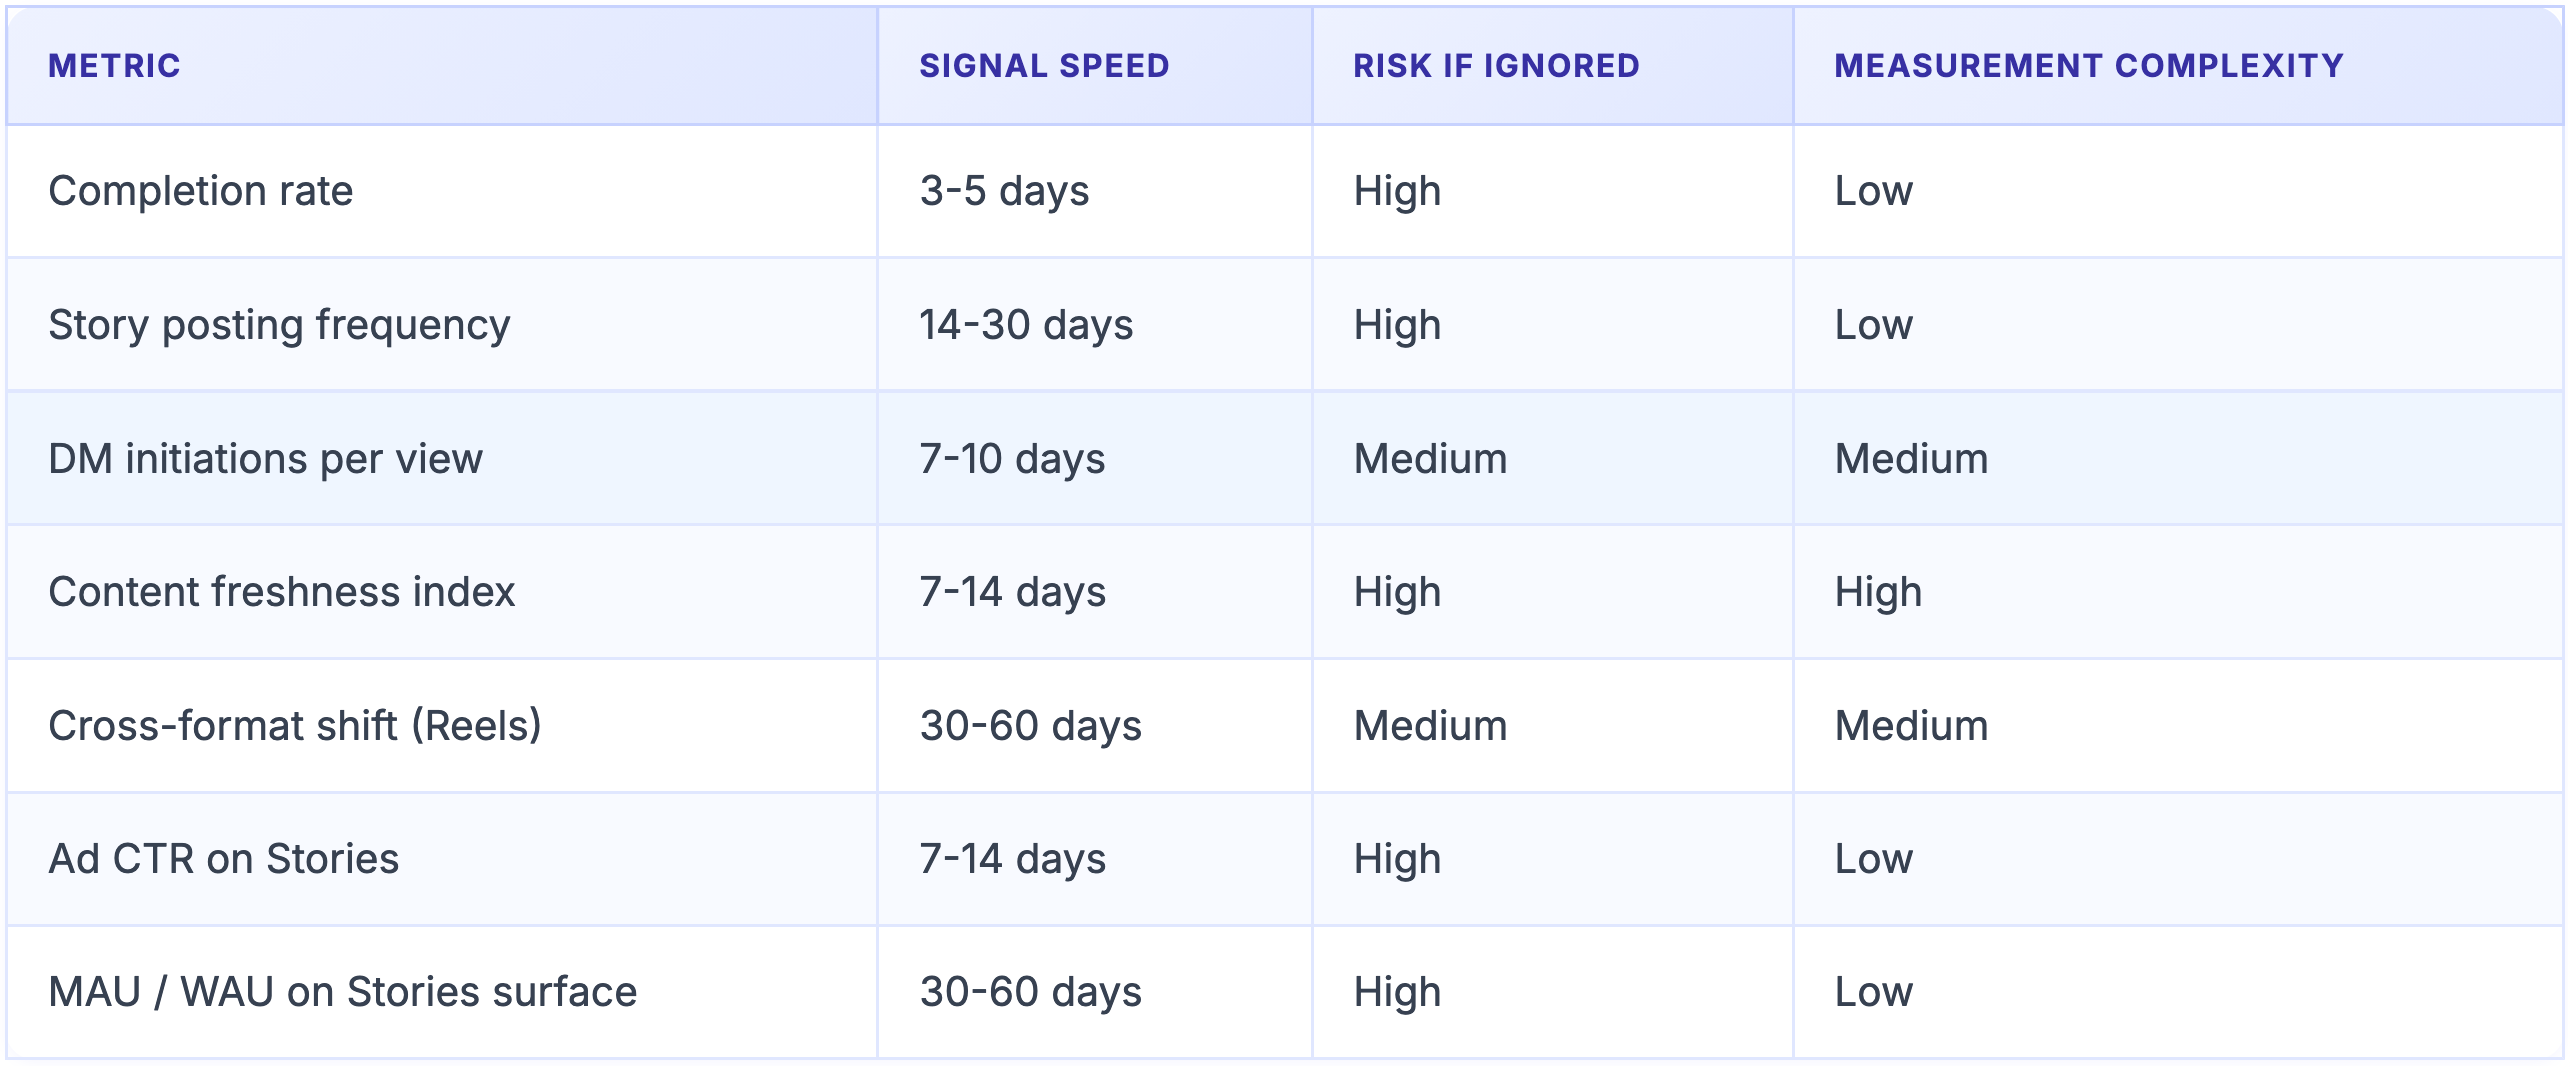
Here’s a rough framework for how to think about which metrics to prioritize and how quickly they’ll signal:
Ad revenue and sponsored story performance
Stories is a high-margin ad surface for Meta. The ad load in Stories is significant, and advertisers pay based on completion and interaction rates. If extending expiration causes completion rates to drop even 5-8% points, that’s a direct hit to CPM rates Instagram can charge. At Instagram’s scale, a 5% drop in Stories CPM across the ad inventory could represent hundreds of millions of dollars in annualized revenue impact. I’d want ad click-through rate (CTR) and video completion rate for ads specifically broken out from organic story metrics, because advertisers will escalate if their ROAS drops without explanation.
Weekly and monthly active user retention on Stories
This is a long-horizon metric but it’s the one I’d tie all the others to. Engagement rate changes in the first two weeks of a test can be noisy. The real question is whether the change increases or decreases the percentage of Instagram users who engage with Stories at least once per week, measured 60-90 days post-launch. Spotify saw something analogous when they changed their podcast recommendation algorithm in 2022: short-term clicks on recommended podcasts went up 18%, but 90-day podcast listener retention dropped 7% because users were being served content that was interesting enough to click but not good enough to build a habit around. The metric that mattered was the lagged retention number, not the immediate click-through.
A/B Testing Design: How to Actually Measure This
Running this test correctly matters as much as knowing what to measure. A few things candidates almost always miss:
