
What is a Gantt chart and when do you use it? - Google Project Mgmt
Google Project Management Interview Question and Answers -What is a Gantt chart and when do you use it?

Dear readers,
Thank you for being part of our growing community. Here’s what’s new this today,
Project Management Interview Preparation: What is a Gantt chart and when do you use it?
Note: This post is for our Paid Subscribers, If you haven’t subscribed yet,
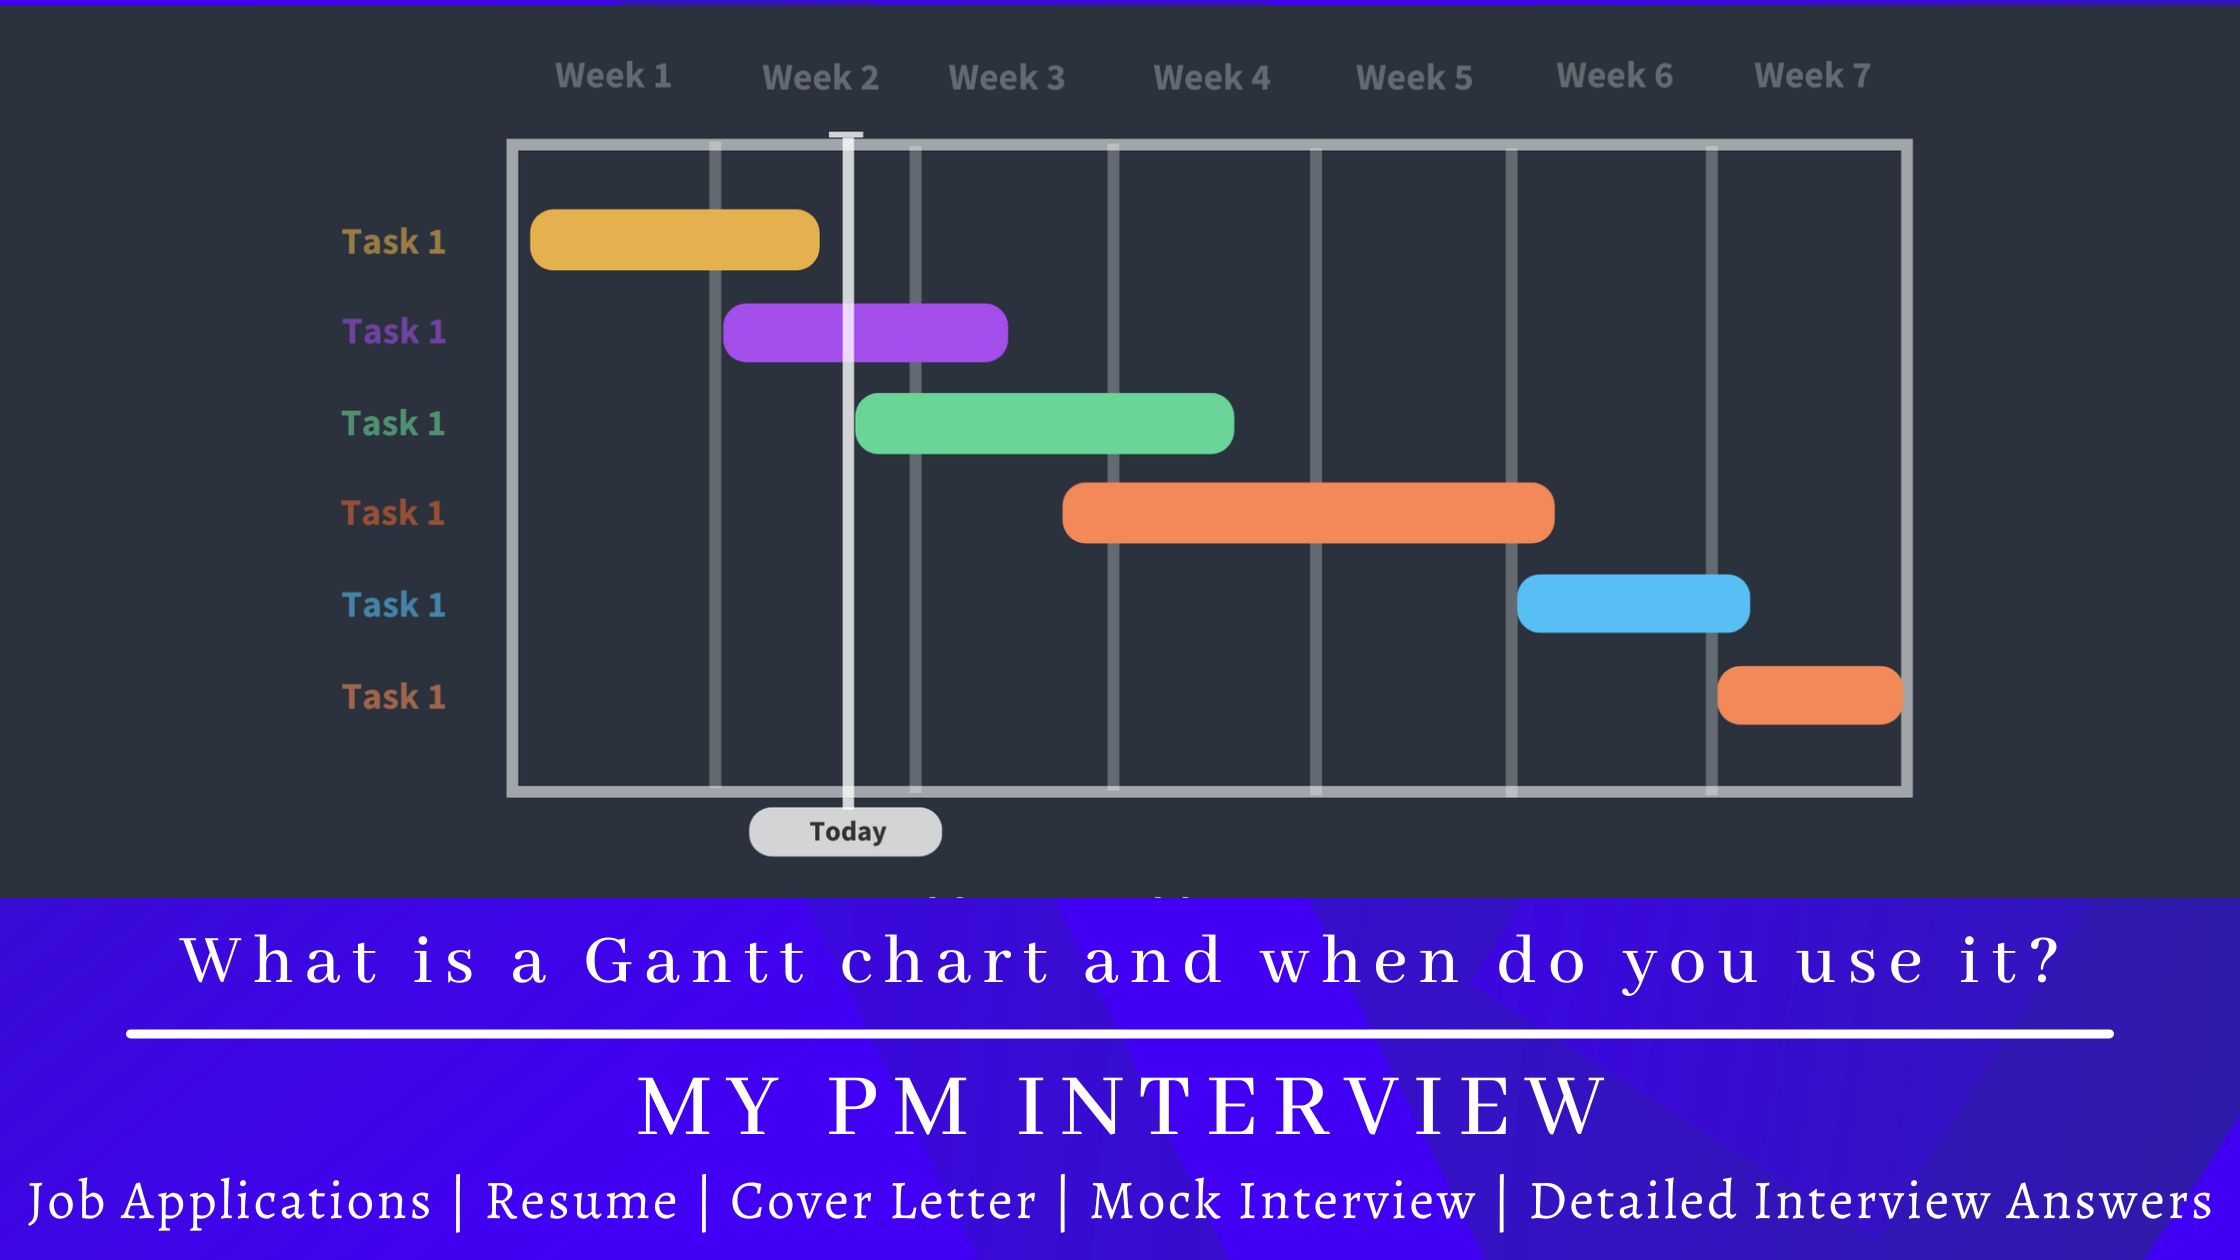
Table of Contents:
What Is a Gantt Chart?
Core Components of a Gantt Chart
When to Use a Gantt Chart
How to Create a Gantt Chart: Step by Step
Types of Task Dependencies
Advantages of Gantt Charts
Limitations of Gantt Charts
Gantt Charts vs. Other Project Management Tools
Industry Applications
Gantt Charts in Agile Environments
Recommended Gantt Chart Software
Common Pitfalls to Avoid
Most teams juggle spreadsheets, Kanban boards, and chat threads to manage projects. But without a shared timeline, deadlines slip, handoffs get missed, and projects drift off course. The Gantt chart was built to solve these exact problems.
A Gantt chart is one of the most widely used visual tools in project management. It maps tasks, timelines, dependencies, and milestones onto a single horizontal bar chart, giving teams and stakeholders a clear, at-a-glance view of the entire project schedule. A study involving 300 management students found that when given a complex scheduling problem, only 1 percent solved it without visual aids. Once the same information was laid out in a Gantt chart format, every student solved it within 15 minutes. That is the power of visual scheduling.
Whether you are managing a construction project with hundreds of interdependent activities, coordinating a software release across multiple teams, or planning a product launch with fixed deadlines, the Gantt chart provides the structure needed to plan, track, and communicate effectively.
This article provides a comprehensive guide to the Gantt chart: its definition and history, core components, when and where to use it, how to create one step by step, its advantages and limitations, how it compares to other project management tools, its role in Agile environments, best practices, and recommended software.
What Is a Gantt Chart?
A Gantt chart is a type of horizontal bar chart that illustrates a project schedule. It displays tasks on the vertical axis and time intervals on the horizontal axis. Each task appears as a bar whose length represents its duration, position shows its start and end dates, and connections to other bars show dependency relationships.
The chart was designed and popularized by Henry Gantt, an American mechanical engineer and management consultant, around 1910 to 1915. Originally created to evaluate the productivity of factory workers, the tool quickly became the standard method for visualizing project schedules across industries. The concept was actually first developed in 1896 by Karol Adamiecki, a Polish engineer who called it a “harmonogram,” but his work was published only in Russian and Polish, limiting its wider adoption.
Modern Gantt charts go far beyond the simple bar charts of the early 20th century. Today’s digital versions show task dependencies, resource assignments, percent-complete shading, critical path highlighting, milestones, baselines for tracking planned versus actual progress, and real-time collaboration capabilities.
Key Definition
A Gantt chart is a graphical representation of activity against time. It lists project tasks on the vertical axis and plots time intervals on the horizontal axis, using horizontal bars to show the start date, end date, and duration of each task. Modern Gantt charts also display dependencies, milestones, resource assignments, and progress status.
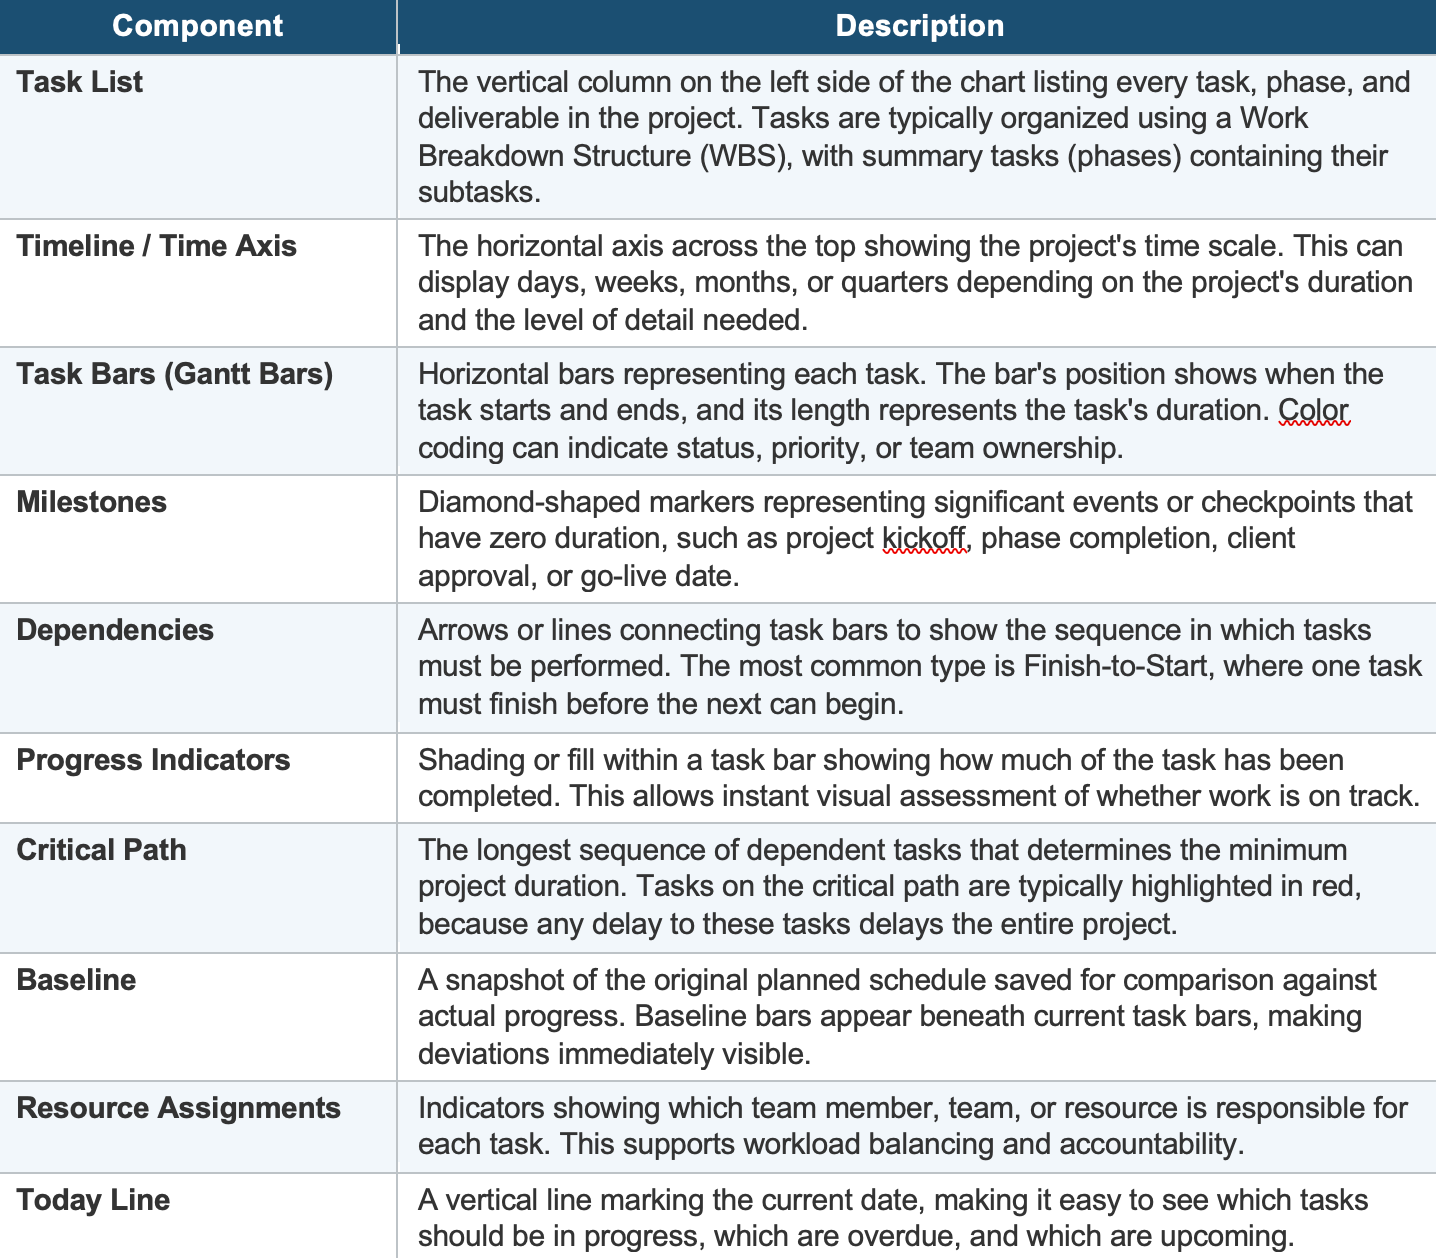
Core Components of a Gantt Chart
Understanding the building blocks of a Gantt chart is essential for both creating and reading one effectively. Each component serves a specific purpose in communicating the project schedule:
When to Use a Gantt Chart
A Gantt chart is not the right tool for every situation, but it excels in specific scenarios. Understanding when to use it ensures you get maximum value from the investment in creating and maintaining one.
Use a Gantt Chart When:
• The project has a defined sequence of tasks: When tasks must happen in a specific order and some work cannot start until other work finishes, a Gantt chart makes these dependencies visible and manageable.
• Deadlines are non-negotiable: Fixed delivery dates, regulatory deadlines, or market-driven launch windows require precise scheduling. Gantt charts show exactly how tasks chain together to meet the end date.
• Multiple teams or stakeholders are involved: Cross-functional projects need a shared visual reference to coordinate handoffs, parallel workstreams, and resource allocation.
• You need to communicate schedules to leadership: Executives and clients want to see the timeline at a glance. Gantt charts provide a professional, clear overview without requiring deep project knowledge.
• The project is complex with many interdependencies: Construction, manufacturing, system migrations, and product launches involve intricate task relationships that benefit from visual mapping.
• You need to track progress against a baseline: Comparing planned versus actual timelines is one of the Gantt chart’s greatest strengths, enabling early detection of schedule drift.
Avoid a Gantt Chart When:
• You are still in the discovery phase: If the project scope is not yet defined, creating a Gantt chart is premature. You will likely need to rebuild it entirely once requirements are clear.
• Work shifts daily and is highly unpredictable: For fast-moving, highly iterative work where priorities change constantly, a Kanban board often provides better visibility with less maintenance overhead.
• The project is very simple: A small project with a handful of independent tasks does not need the overhead of a Gantt chart. A simple task list or checklist may suffice.
• You need to manage costs and scope primarily: Gantt charts focus on time. For scope management, use a WBS. For cost tracking, use budget reports or earned value analysis alongside the Gantt chart.
